Against the backdrop of increasingly complex global commodity trade and growing market volatility, enterprises are facing more severe challenges in market risk management.
Problems such as separation of physical and paper positions, unclear risk identification, unknown risk sources, and weak ability to respond to extreme events make traditional risk control systems inadequate for high-frequency, large-scale, and highly variable business needs.
In this context, Fusion CTRM emerged to provide the commodity trading industry with a systematic market risk management solution.
Its goal is to fully enhance the company’s resilience to risks and improve decision-making quality.
I. Pain Points in Market Risk Management for the Commodity Trading Industry
When exploring market risk management in the commodity trade sector, we must first recognize and deeply understand its core pain points.
Pain Point 1: Inability to quantify overall risk in real time; difficult integration of physical and paper positions
In traditional systems, physical and paper position data are separated. This makes it hard to calculate integrated exposures, delays profit and loss results, and prevents real-time risk overviews.
Pain Point 2: Disorganized basic data, unable to support multi-scenario exposure calculations
Contracts, prices, and forward pricing methods are diverse. Traditional systems cannot adapt to complex pricing logic, leading to distorted or delayed exposure and P&L calculations.
Pain Point 3: Single risk indicator, unable to cover extreme losses and key risk sources
Relying solely on traditional VaR calculations cannot reveal losses under extreme scenarios, nor identify specific risk sources.
Pain Point 4: Inability to simulate extreme market conditions, lack of stress testing tools
When black swan events occur (such as sudden wars or supply chain disruptions), companies cannot assess potential risks in advance and often remain passive.
These pain points leave commodity trading companies “flying blind” when facing market volatility and external shocks.
Their risk management lacks systemization, real-time responsiveness, and foresight. This not only weakens profitability but also creates hidden dangers for significant financial and reputational losses.
II. Fusion Market Risk Management Solution
To address the above challenges, Fusion CTRM offers a comprehensive and in-depth market risk management solution.
It helps enterprises build a more robust and efficient risk management framework. The solution includes mark-to-market P&L, value-at-risk (VaR) series indicators, and more.
1. Mark-to-Market P&L
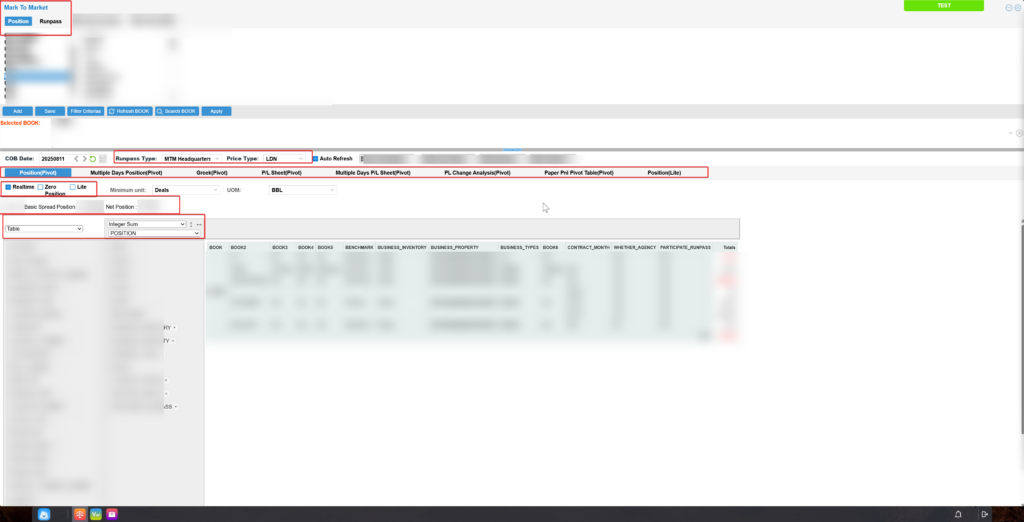
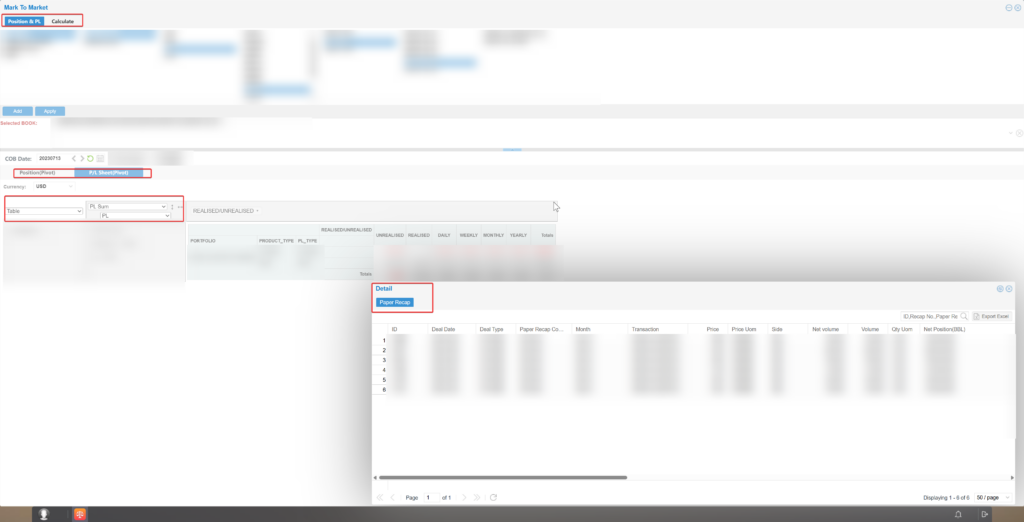
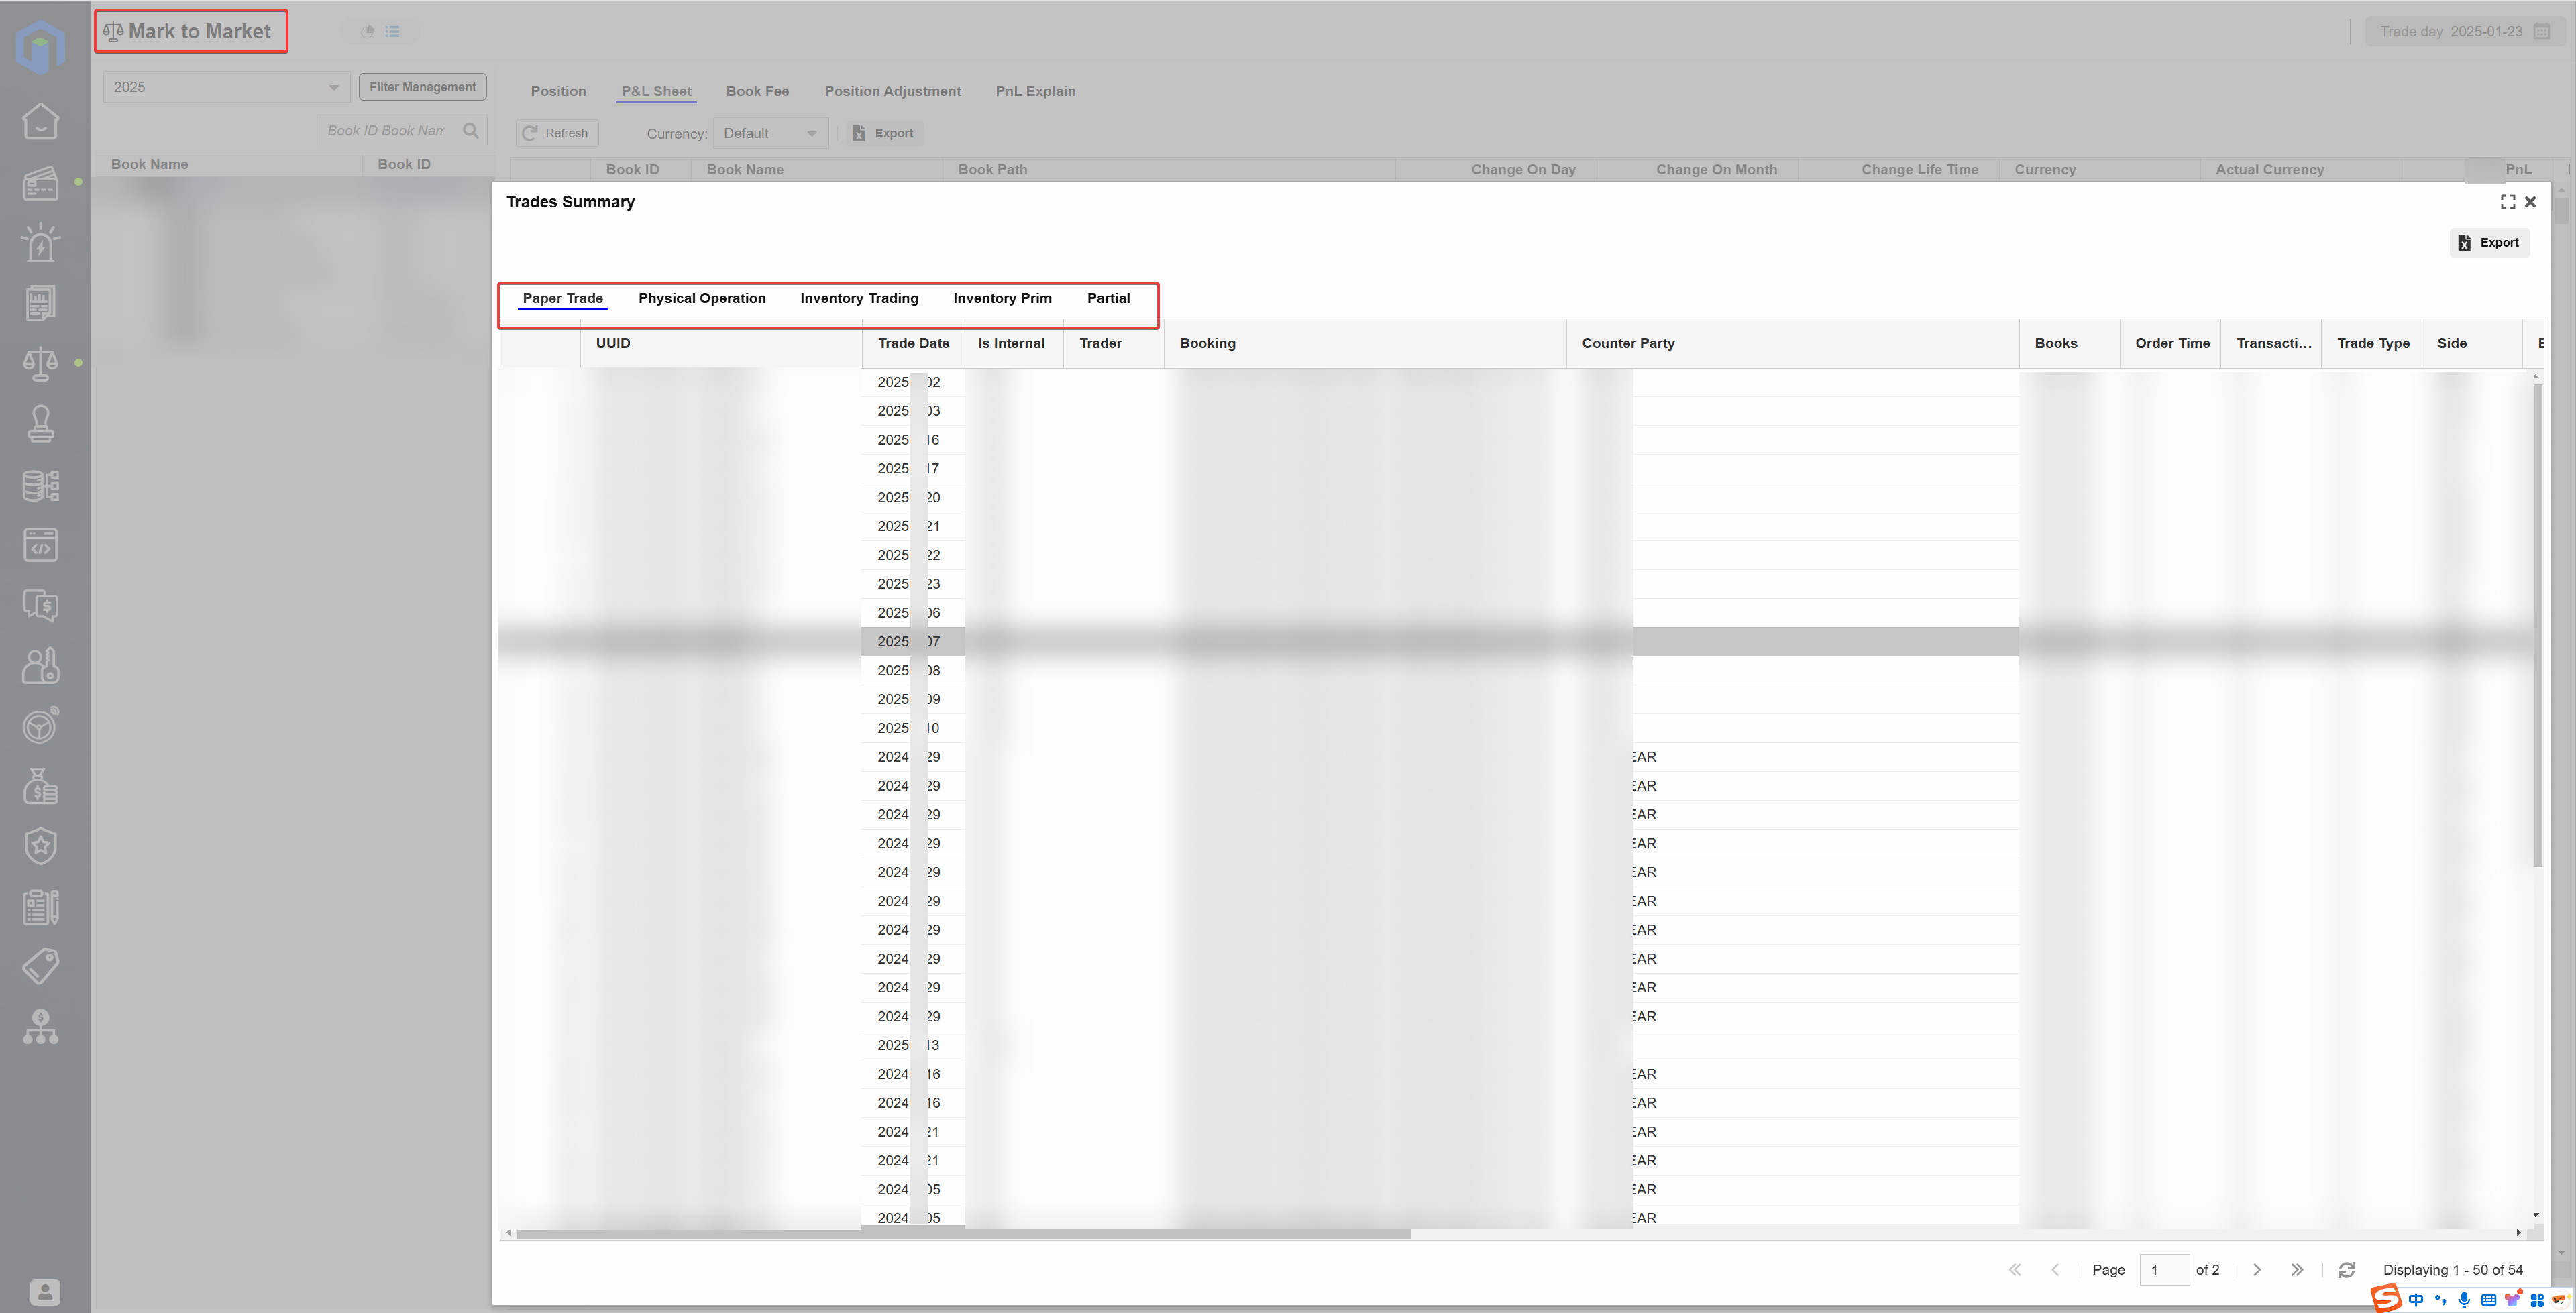
Mark-to-market P&L relies on daily reports and portfolio statistics. It calculates exposures and P&L for physical goods, paper positions, and inventory with multi-dimensional and multi-level precision.
It can compute integrated exposures for physical and futures positions, as well as pure speculative exposures, in real time. This enables one-stop monitoring of the company’s overall P&L, forming a complete set of quantitative risk indicators to support market risk management.
Market Risk Master Data Management
Through the data settings module, the system manages master data such as contracts, benchmarks, paper position product types, historical prices, and forward prices.
For forward prices, it can automatically calculate multiple sets of prices, such as LND (London close forward price), TAS (trade date settlement forward price), and margin call forward prices for accounting purposes.
This meets the need for exposure and P&L calculations based on multiple forward price sets.
Pricing Formula Support
The system can interpret various pricing formulas for physical goods, including fixed price, average price, event-based price, priced-at-points, complex pricing, and complex average pricing.
This supports P&L and exposure calculations for different physical trade scenarios.
Exposure and P&L Calculation
From portfolio management and business logic perspectives, the system integrates trading information for physical goods, paper positions, and inventory. Combined with market risk master data, it calculates exposures and P&L with precision.
On this basis, risk management functions include position calculation, as well as the calculation, analysis, and change attribution of profit and loss.
Position-related Functions
- Flexible Query: Supports real-time and historical position queries. Can calculate exposures for different stages such as pricing periods and trade dates, allowing dynamic display of exposure changes.
- Multiple Display Options: Can display zero positions, company-level net positions, and basic spread positions.
- Multi-day Positions: Supports queries for any time period, with separate views for total, closed, and open positions.
P&L-related Functions
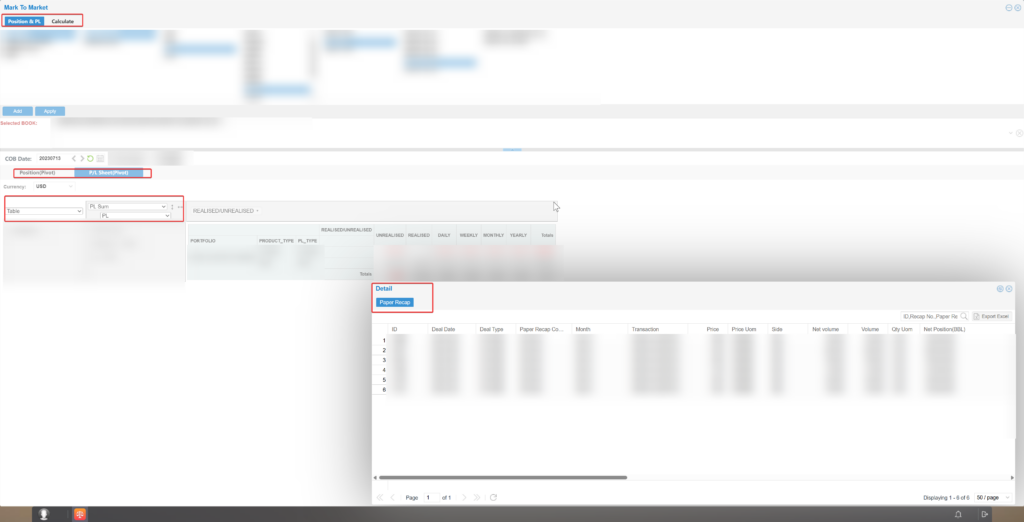
- Single-day P&L Table: Supports multiple currencies. Can split and match P&L, and display archived or year-to-date P&L.
- Multi-day P&L Table: Aggregates by time dimension, showing total, floating, and realized P&L for different periods, with multi-dimensional analysis.
- Change Analysis: Compares P&L changes between two dates by factors and pathways. Breaks down reasons such as quantity changes, pricing period changes, contract changes, and price changes, helping companies make timely decisions.
Other Features
- Chart Analysis: The pivot table in the query interface allows free combination of fields such as statistical dimensions, items, and chart types for customized chart analysis.
- Detail Query: Allows drill-down to view all transaction details related to exposure and P&L, including ledgers and pricing records.
- Options Evaluation:Supports calculation of Greeks to measure the sensitivity of option prices to other factors, aiding option pricing and risk assessment.
- Calculation Management:Provides calculation logs to check errors, with functions to lock and unlock calculation data.
2. Risk Value-at-Risk (VaR) Series Indicators
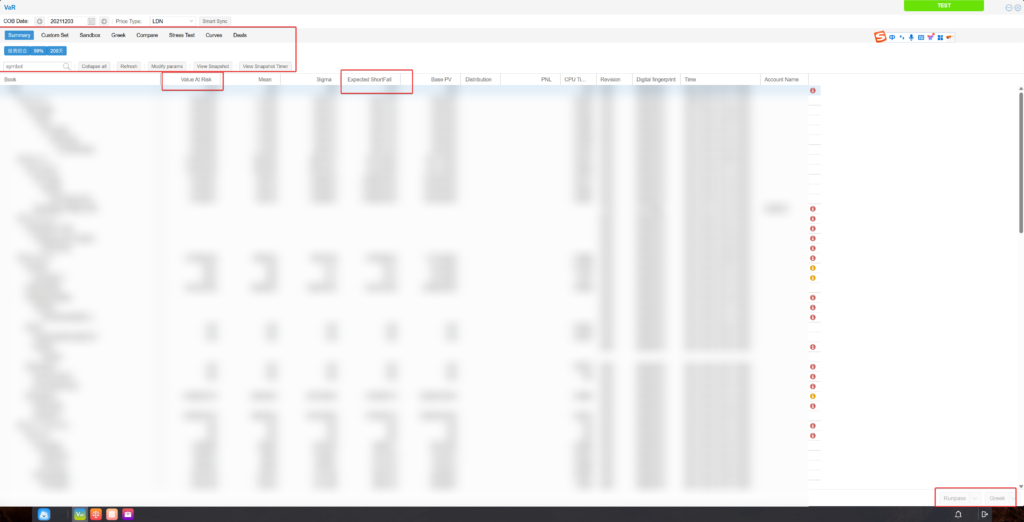
The VaR module supports multiple calculation models for VaR and other risk measurement metrics.
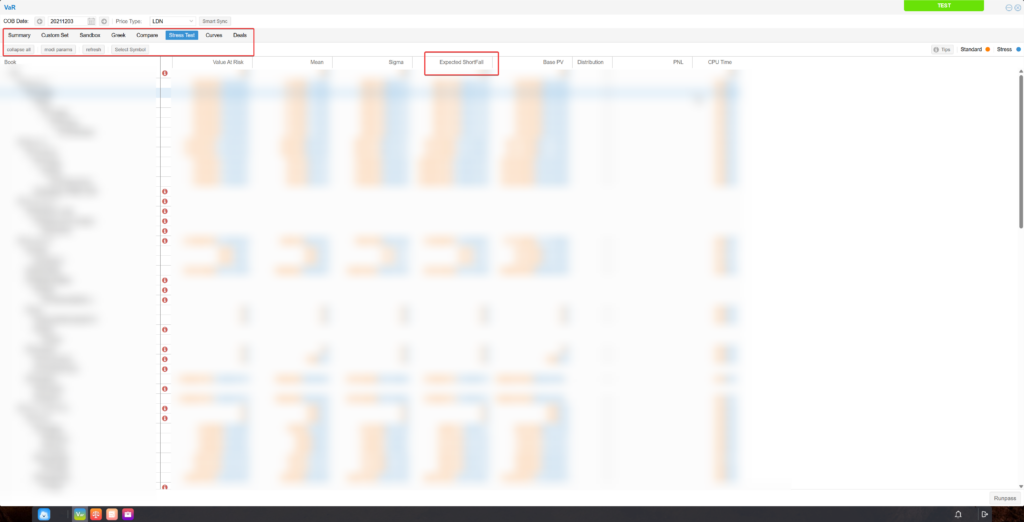
These include VaR, Greek values, stress testing, Expected Shortfall (ES), and scenario simulation.
It also supports personalized VaR analysis for specific portfolios. Details are as follows:
VaR Indicator:
VaR (Value at Risk) is one of the core tools in financial risk management.
It is widely used by financial institutions to quantify the maximum potential loss of an asset or portfolio within a given time period, at a specific confidence level.
For example, if an oil trading company’s long crude oil position has a VaR (99%, 1 day) = RMB 1.5 million, it means:At 99% confidence, the maximum loss in the next trading day is RMB 1.5 million.There is a 1% chance the loss will exceed RMB 1.5 million.
The system uses real historical data and various calculation models to predict the possible distribution of future profit and loss over a given time horizon.It identifies the worst 1% of losses based on a set confidence level (e.g., 99%) and determines the VaR accordingly.
Trading companies can use this to understand the maximum loss they may face with a certain probability, plan investment strategies, or set stop-loss limits.
Expected Shortfall Indicator:
VaR has limitations — it cannot measure extreme losses beyond the set confidence level.
Expected Shortfall (ES) addresses this gap by showing the average loss in the worst cases beyond the VaR threshold.
For example, at a 99% confidence level, VaR indicates “loss will not exceed X in 99% of cases.”ES tells you the average loss in the remaining 1% of worst-case scenarios.The system provides ES to measure extreme loss risk.
Stress Testing:
This assumes certain extreme market scenarios, based on statistical models or historical events.
For instance, if a specific commodity price fluctuates abnormally, stress testing can calculate the resulting volatility in related commodities and estimate the maximum possible loss.It also compares VaR values before and after the shock.
This helps companies understand how extreme market movements in one product might impact others and the overall portfolio, enabling them to assess resilience against black swan events and improve targeted risk controls.
Scenario Simulation (“Sandbox” Model):
If you want to manually test how extreme price changes in a commodity affect its VaR, you can use the sandbox model.
This allows custom test conditions.For example, inputting an extreme price surge or drop will let the system calculate VaR under that scenario.This enables flexible, daily risk factor testing and exploratory analysis.
Greek Indicators:
The VaR module also provides Greek values to pinpoint sources of risk in a portfolio.Greeks, calculated through VaR valuation models, help identify the main risk drivers.
Select a portfolio in the Greek interface, and the system generates a list of Greek values.Values equal to or near zero indicate low or no risk.The higher the number, the greater the risk.
Companies can hedge high-risk portions to improve returns and reduce exposure.
3. Risk Limits
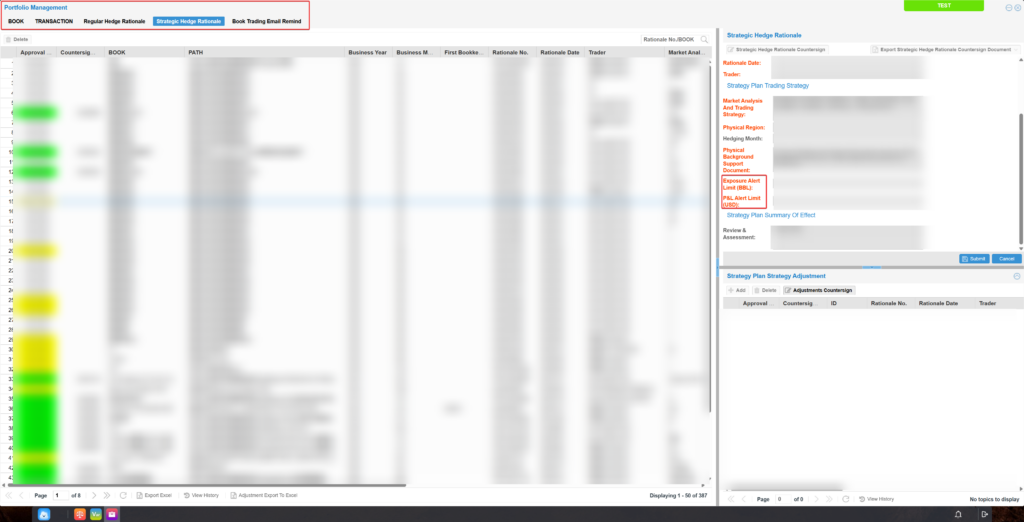
The system allows multi-dimensional risk limit settings, based on related risk indicators and actual business needs.
Limits can be set from the company level down to subsidiaries, traders, trading portfolios, and even specific deals.These include stop-loss limits, exposure limits, and daily P&L limits.
This clearly defines the boundaries of legal trading and positions.When a limit is triggered, alerts activate immediately, enabling rapid emergency response.This ensures end-to-end risk control — before, during, and after trades.
4. Risk Control Reports
The system can generate customized, diversified risk analysis reports based on client requirements.
Reports can cover management-level summaries, subsidiary/department risk reports, data quality checks, and P&L limit reports.
It supports generating both summary and detailed reports under different metrics, such as daily or monthly risk reports.
With these reports, companies can gain a full and detailed view of their risk exposure.This provides a solid basis for informed decision-making and enhances both decision quality and resilience.
In summary, the Fusion Market Risk Management Solution builds a comprehensive and layered risk control framework:
- Mark-to-market P&L serves as the foundation, calculating exposures and P&L with precision and transparency.
- VaR and ES offer deeper insights into extreme losses.
- Stress testing and sandbox modeling analyze risk factors under unusual scenarios.
- Greek indicators pinpoint specific risk drivers, giving companies a complete risk profile.
- Risk limits then define boundaries, ensuring full-cycle prevention and control.
- Risk reports, with personalized and multi-dimensional analysis, provide accurate references for decision-making.
Together, these elements greatly enhance a company’s ability to withstand market risks.
Next, we will examine Fusion’s implementation in Company H to validate its market value and application potential.
III. Implementation and Results of the Fusion Market Risk Solution in Company H
Company H is a large international oil trading enterprise.Its daily trading volume and transaction amounts are massive.It also faces the common market risk management challenges mentioned earlier.
To address these pain points effectively, Company H decided to introduce Fusion’s market risk management modules.
This included mark-to-market P&L, the VaR module, and more.Below are the implementation plan and results.
Pain Point 1: Unable to quantify overall risk in real time, with difficulty integrating physical and futures positions.
Implementation:
By using daily mark-to-market reports and portfolio management statistics, the system achieved real-time calculation and analysis of integrated physical and futures exposure and P&L.
- Integrated Physical–Futures Exposure:
The system supports exposure calculations for physical goods, paper futures, and inventory.It generates company-wide total P&L in real time and forms a set of quantitative risk indicators (such as VaR and Greek values) to cover integrated risks across physical and futures markets. - Real-Time Risk Overview:
It provides single-day and multi-day P&L tables, as well as position query functions.P&L can be analyzed over different time dimensions and from multiple perspectives.This ensures management can grasp overall risk in real time.
Results:
After implementation, integration efficiency for physical–futures exposure improved by 80%.Company-wide total P&L is now generated in real time.
Management can obtain a real-time risk overview in under 10 minutes through the single-day/multi-day P&L and position query features.Accuracy of the quantitative risk indicator set exceeds 90%.
Pain Point 2: Disorganized basic data, making it impossible to support multi-scenario exposure calculations.
Implementation:
Using the market risk basic data management module, the company standardized data for contracts, prices, forward pricing methods, and more, supporting complex pricing logic.
- Data Standardization:
Through the data settings module, contracts, benchmarks, and other core data are managed in a standardized way.The system supports automatic calculation of multiple forward pricing models, including LND, TAS, and Margin Call, ensuring accurate exposure and P&L calculations. - Flexible Scenario Adaptation:
Pricing formulas can interpret and support any type of pricing logic.This enables multi-scenario calculations for both physical trading and new business types.
Results:
After standardization, the error rate in managing basic data such as contracts and benchmarks fell below 3%.Accuracy for automatic calculation of LND, TAS, and Margin Call forward prices reached 98%.
The pricing formula now adapts to over 90% of multi-scenario calculations for physical trading and new business types.
Pain Point 3: Single risk indicator, unable to cover extreme losses and key sources of risk.
Implementation:
The company introduced multiple risk indicators — VaR, Expected Shortfall (ES), and Greek values — to fully cover extreme losses and identify sources of risk.
- Combining VaR and ES:
VaR quantifies the maximum potential loss at a certain confidence level.ES supplements this by measuring the average extreme loss beyond the VaR threshold, addressing VaR’s limitations. - Greek Value Analysis:
Greeks calculate the sensitivity of option prices to other factors (e.g., Delta, Gamma).Combined with VaR, they help pinpoint high-risk segments in the portfolio, guiding hedging strategies.
Results:
With these multi-dimensional indicators, coverage of extreme losses through VaR and ES reached 95%.Greek value analysis achieved 90% accuracy in identifying high-risk segments.
This effectively guided hedging operations and reduced risk exposure by 50%.
Pain Point 4: Unable to simulate extreme market scenarios, lacking stress testing tools.
Implementation:
Through stress testing and sandbox testing models, the company simulated risk exposure under extreme market conditions.
- Stress Testing:
The system assumes extreme market scenarios, such as abnormal price fluctuations.It calculates correlated volatility in related products and the maximum possible loss.A comparison of VaR values before and after the shock helps evaluate resilience against black swan events. - Sandbox Testing:
Users can manually adjust extreme price values.The system then calculates the VaR under those extreme conditions.This highly flexible approach is suitable for daily risk analysis and exploratory testing.
Results:
With stress testing, major products achieved minute-level disturbance analysis.Computation efficiency improved eightfold.Report generation time for stress test results dropped from hours to minutes.Accuracy of pre- and post-disturbance VaR calculations reached 96%, effectively assessing resilience to black swan events.
Sandbox testing has been applied to over 85% of daily risk analysis scenarios, allowing flexible simulation of extreme VaR values.
The implementation of Fusion’s market risk management solution has fundamentally shifted Company H from passive, after-the-fact response to proactive, pre-emptive warning.
Through a unified physical–futures exposure accounting system, the introduction of multi-dimensional risk indicators (VaR, ES, Greeks), and minute-level stress and sandbox testing, Company H now achieves real-time visibility, measurability, and controllability of global trading risk.
This has significantly enhanced the company’s resilience to extreme market events and improved business stability.
IV. Conclusion
Fusion’s market risk management solution not only addresses the core challenges of the bulk commodity trading industry — risk quantification, data integration, indicator development, and stress testing — but also demonstrates in Company H’s case a well-designed, robust, and highly effective system.
With a unified physical–futures risk perspective, a flexible indicator framework, and forward-looking extreme scenario simulation capabilities, the solution helps enterprises rebuild their market risk control capacity.
It enables a shift from post-event analysis to real-time quantification, and from static views to dynamic warnings.
The successful application in Company H fully validates the practical value of the Fusion solution.Its configurable, highly adaptable design also offers a practical and quickly deployable risk management path for other large trading enterprises.
As global market uncertainty continues to rise, this solution is well positioned to become a key enabler for companies seeking to strengthen risk resilience and enhance operational stability.




2 Responses
Great information!
Thank you!You can leave a message if you have further needs.