In today’s digital transformation era, data is not just a record of business activities, but an essential asset driving business growth. However, many companies still face the following issues: the difficulty in integrating massive data, challenges in ensuring data quality, decision-making processes relying on cumbersome manual operations, and the inability to keep up with the pace of market changes. This is especially challenging in sectors like the competitive and complex commodities trade, where these problems significantly impact the accuracy and timeliness of business decisions.
Traditional tools such as Excel face inherent limitations when addressing these issues: a lack of flexibility and an inability to meet the complex and ever-changing business requirements. To solve these pain points, X-Ray was developed. As an intelligent tool integrating data governance, data analysis, and decision support, X-Ray not only helps companies solve data integration and quality issues, but also uses intelligent analytical capabilities to enable faster and more accurate decision-making.
Let’s first analyze the data pain points that most companies face in decision-making today.
1. Data Pain Points in Business Decision-Making
When companies are making data-driven decisions, they often encounter the following four major pain points. These issues not only diminish the actual value of data but also make it difficult for companies to respond quickly to market changes.
1.1 Challenges in Effective Data Integration and Governance
Problems:
- Data silos are severe: Data is scattered across various departments or systems, such as ERP, CRM, and external market data sources, making integration difficult.
- Insufficient external data resources: Companies often rely on a single channel for acquiring market trends, competitor information, and other external data, which results in a narrow perspective for analysis.
- Data quality issues: Existing data lacks accuracy and completeness, and real-time updates are insufficient, leading decision-making to be based on incorrect or outdated data.
Comparative Analysis: Compared to the above issues, Excel’s manual integration method is inefficient and prone to errors. While BI tools can integrate some data, they lack the flexibility to handle real-time dynamic data and are unable to form a comprehensive data view.
1.2 Insufficient Data Processing Automation
Problems:
- Data collection, cleaning, and integration are mostly manual, making the process cumbersome and inefficient.
- Analysts spend most of their time preparing data, leaving little energy for deep analysis and decision optimization.
Comparative Analysis: Excel and BI tools cannot automate data cleaning and processing; users need to manually perform repetitive tasks, extending the overall data analysis cycle.
1.3 Limitations of Analytical Tools
Problems:
- Traditional tools fail to meet the demands of data integration, high-performance computing, and complex analytical model development, especially when dealing with dynamic market scenarios.
- Weak ability to develop personalized models, making it difficult to respond quickly to specific analytical needs, resulting in delayed decision-making that relies heavily on experience.
Comparative Analysis: Excel is suitable for simple calculations, but it struggles with complex data scenarios. BI tools are efficient in fixed-template analysis but lack flexibility and in-depth support. They also lack sufficient data integration and processing capabilities.
1.4 Limited Application Value of Data
Problems:
- Traditional tools often provide basic analytical functions, requiring users to interpret the data and generate reports, which increases decision-making time and the risk of errors.
- Companies lack targeted analytical support in key business scenarios (such as risk alerts and profit-loss attribution), preventing timely and effective business insights.
Comparative Analysis: BI tools can generate simple reports but cannot provide in-depth analytical results, offering weak decision-making support.
2. How X-Ray Solves Data Pain Points and Enhances Decision Quality
In response to the data pain points companies face in decision-making, X-Ray offers comprehensive and efficient solutions through its powerful functional modules. Unlike traditional tools, X-Ray not only focuses on solving data integration issues but also emphasizes empowering deep analysis capabilities, significantly improving the quality of business decisions.
The following sections will analyze the core advantages of X-Ray and its practical applications in businesses from four perspectives: data integration and governance, data processing automation, intelligent analytical tools, and data decision support.
2.1 Data Integration and Governance
Functionality Implementation:
- Enterprise Data Integration: X-Ray uses the XDK data collection toolkit for non-intrusive, automated, and real-time collection of system data, text files, Excel sheets, and other data sources. It unifies internal online and offline data resources and standardizes data through industry-standard mapping and intelligent data cleaning to ensure data usability.
- External Data Access: X-Ray integrates external market data sources, such as financial information from the trading sector, macroeconomic data, and specific industry data, through the X-Data module, helping enterprises build a global view. This allows companies to merge internal and external data for analysis and decision-making.
- Data Quality Optimization: X-Ray provides data inspection and validation features, automatically detecting and correcting errors to ensure data accuracy and completeness. Real-time data processing across the entire workflow—from data import to checks, calculations, and report generation—ensures the timeliness of data, enabling companies to make decisions based on the latest information.
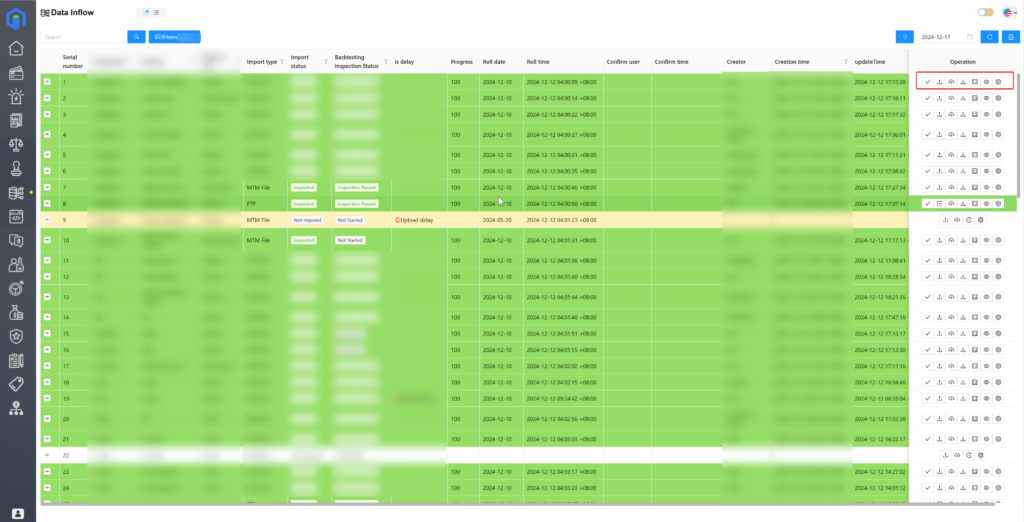
Practical Advantages: Compared to traditional tools, X-Ray achieves data integration and standardization, provides rich external data, optimizes data quality, and offers reliable foundational data support for decision-makers.
2.2 Data Processing Automation
Automated Workflow:
- X-Ray automates the entire process from data collection to analysis results, including data import, inspection, calculation, and report generation.
- Data Import: XDK supports various import methods, including remote import, scheduled automatic imports, and manual imports. Remote imports enable real-time and automated data system integration.
- Data Inspection: Data cleaning and validation algorithms support automated data processing and checks.
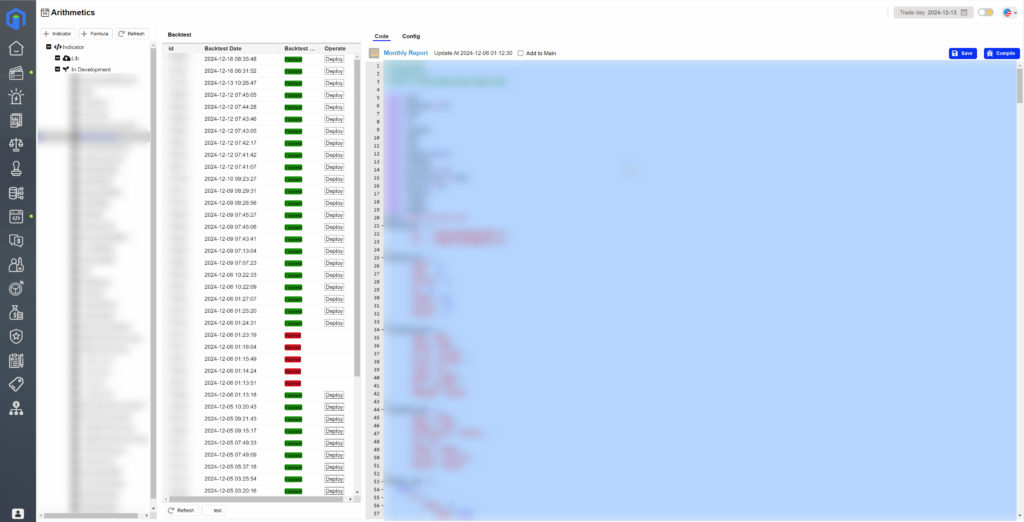
- Data Calculation: The X-BT backtesting framework automates data model calculations based on preset indicators, meeting real-time data calculation requirements.
- Report Generation: X-Ray supports the automatic generation, archiving, and real-time updating of enterprise-standard business reports.
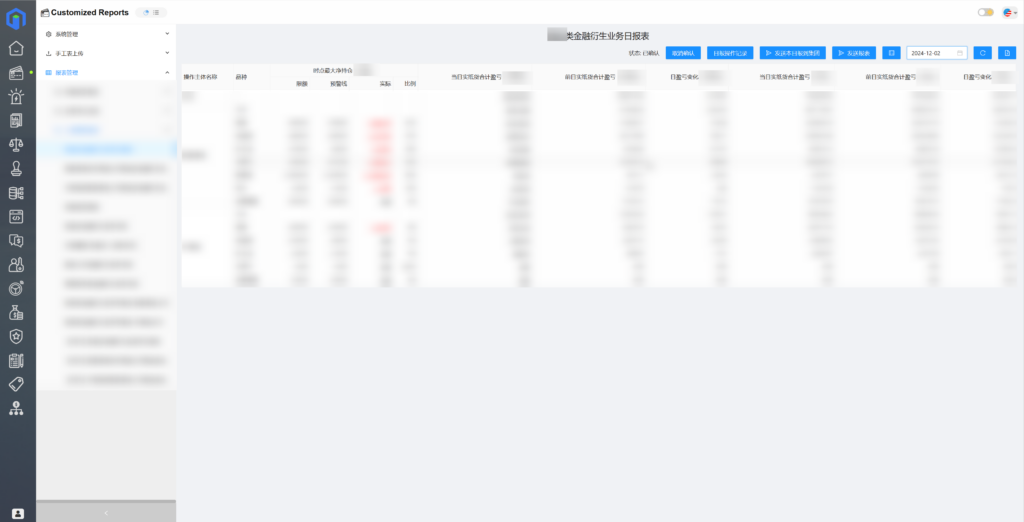
Time Savings: The automated data processing workflow saves over 50% of the data preparation time for analysts, enabling them to focus on high-value business analysis.
2.3 High Cost-Performance of Intelligent Analytical Tools
Core Modules:
X-BT Backtesting Framework: X-BT includes rich computational resources and industry model packages that support everything from common indicator calculations to personalized model development. It provides efficient computing capabilities for complex scenarios, helping businesses quickly complete complex calculations and analyses.
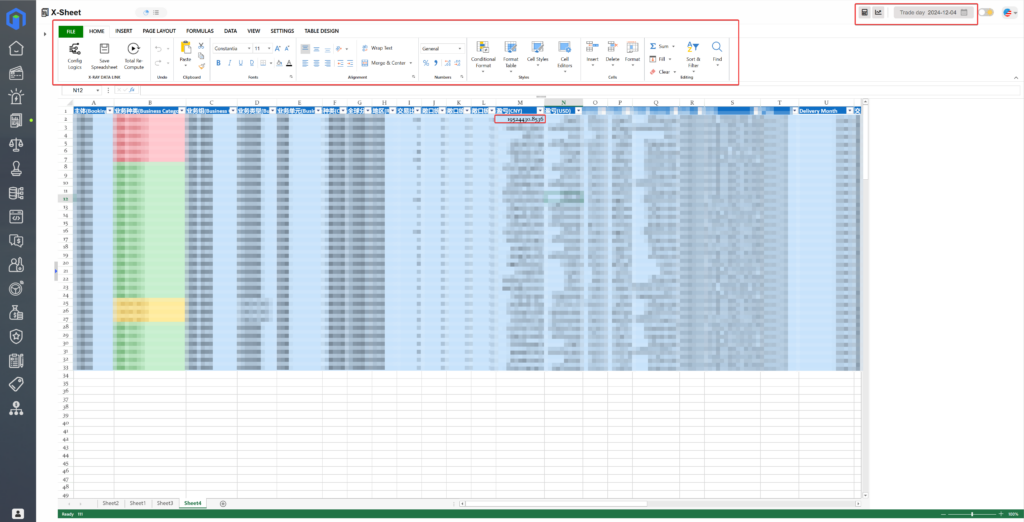
X-Sheet Data Reporting Tool: X-Sheet allows the configuration of various system indicators to generate personalized real-time reports with a single click, automatically updating and archiving data reports to meet custom reporting needs. It offers an Excel-like user interface and a variety of report templates, making it convenient and user-friendly for personalized analysis.
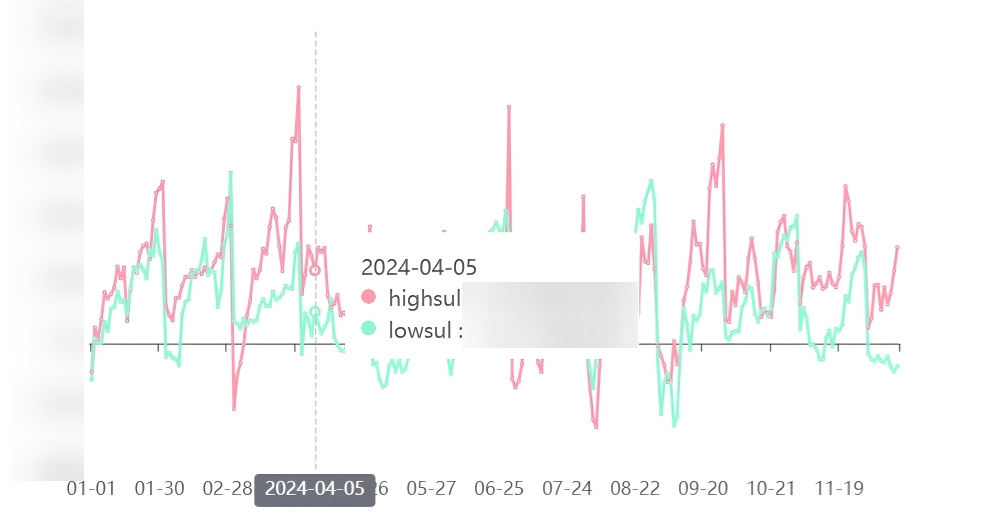
X-Insight Visualization Tool: X-Insight provides various data visualization charts such as line charts, pie charts, area charts, scatter plots, and radar charts, creating more intuitive, multi-timeframe charts that help decision-makers quickly understand analysis results.
Comparative Advantage: Compared to Excel’s simple calculations and BI tools’ template-based analysis, X-Ray offers deeper personalized analysis support, significantly enhancing decision-making efficiency.
2.4 Data Application and Decision Support
Value Presentation:
- X-Ray directly generates in-depth analysis reports, including profit-loss attribution, trader performance, and risk alerts, providing targeted business insights for companies.
- The X-Eagle Risk Alert Module offers real-time monitoring and automated notification features, helping businesses avoid potential risks.
3. X-Ray’s Practical Application Cases in Businesses
3.1 Case Background
Z Company is a large oil trading company engaged in international trade of crude oil, refined oil, chemicals, and natural gas, with branches located worldwide.
It has a strong reputation in the international energy market. Its business volume, trade volume, and data volume are enormous, handling over ten million tons of trade per year and reaching a trade volume of up to billions of dollars, processing 20 million rows of data daily.
In its global operations, it faces the following problems: internal data is dispersed and of poor quality, external data is hard to obtain, analysis efficiency is low, and it lacks real-time risk alert capabilities.
3.2 Implementation Process
- X-Ray integrated internal transaction and market data to build a dynamic data platform, eliminating data silos.
- The X-BT backtesting framework was used to develop personalized models, optimizing risk assessments and business strategies.
- Through X-Sheet and X-Insight, personalized real-time reports and visual charts were generated to provide real-time support for decision-makers.
- The X-Eagle risk control alert module monitored market risk indicators in real-time, helping the company avoid risks.

3.3 Results and Benefits
- Data integration and processing time was reduced by 50%, and analysis efficiency increased by 70%.
- With the risk alert function, the company avoided several potential loss incidents within a year, saving tens of millions of dollars.
- Profit-loss attribution reports helped identify issues in trading patterns, optimizing strategies and significantly improving the annual return rate.
- Trader performance optimization improved performance management and the company’s overall trading and risk management.
4. Conclusion
X-Ray, by integrating data resources, improving analysis efficiency, and strengthening decision support, provides companies with a new solution that goes beyond traditional tools. In the era of data-driven decision-making, X-Ray is not just a tool, but one of the core competencies for companies to cope with complex market challenges.

