With the arrival of the era of big data, enterprises face massive, complex, and multi-dimensional data streams. Extracting valuable insights from this data has become an indispensable challenge in decision support systems. Data visualization, as a tool for effectively conveying data analysis results, is increasingly relied upon by enterprises.
However, while traditional data visualization tools such as Excel and BI systems can provide basic chart displays, they often face significant limitations when handling complex time-series data, real-time dynamic data, and large-scale datasets.
To address these issues, X-Ray has introduced an innovative data visualization solution that integrates the Feynman Language and X-Insight dashboard, offering enterprise users a new way to process and display data efficiently and in real-time.
This article will explore how X-Ray, through its unique Feynman Language, micro-formulas, and X-Insight dashboard, overcomes the limitations of traditional data visualization tools and provides enterprises with a more flexible and efficient solution.
I. Pain Points in Enterprise Data Visualization and Limitations of Traditional Tools
With the accelerated pace of enterprise digitalization, the complexity and diversity of data continue to grow. Traditional tools like Excel or BI systems often exhibit the following challenges in meeting enterprise data visualization needs:
1.1 Complex and Time-Consuming Data Processing
Traditional tools require enterprises to manually process massive datasets, including filtering, calculations, and data preparation, before visualizing them. This process increases analysis time and risks human error, particularly when handling complex datasets, significantly impacting efficiency and accuracy.
1.2 Lack of Real-Time Data and Dynamic Display
Although BI tools and Excel can generate static reports and charts, they fall short in handling real-time dynamic data. These tools often rely on manual updates and refreshes, leading to delays in data updates and affecting the timeliness and accuracy of decision-making.
1.3 Limited Visualization Options
Excel offers a limited variety of charts, which are often not intuitive for visualizing complex data. Users frequently need to manually adjust chart styles to achieve desired effects. While BI tools support more chart types, their complex configurations create a high barrier to use, especially for non-technical personnel.
1.4 Poor Responsiveness to Dynamic Business Changes
In dynamic business environments, fixed data models fail to respond quickly to new requirements. Excel and BI tools typically rely on generic models, lacking industry-specific templates. Users often need to create business models through complex operations and additional tools, which is time-consuming and inefficient, limiting their responsiveness.
II. X-Ray: A Data Visualization Solution with Feynman Language and X-Insight
To solve the above pain points, X-Ray offers a comprehensive data visualization solution that combines the Feynman Language and the X-Insight dashboard, enabling enterprises to achieve more efficient, flexible data processing, analysis, and display. Below is a detailed introduction to their features and benefits.
2.1 Features and Advantages of Feynman Language
Feynman Language is a lightweight programming language designed for time-series data analysis. It is simple, flexible, and efficient, enabling users to define and process complex time-series data quickly. Its main advantages include:
- Simplicity and Ease of Learning: Feynman Language features intuitive syntax that requires no programming background. Even non-technical users can quickly master it and use simple code to process and analyze data.
- High Flexibility: The language supports user-defined data metrics (micro-formulas), allowing adjustments to data processing logic based on business needs, accommodating diverse analysis requirements.
- Real-Time Processing: It integrates seamlessly with X-Ray’s real-time data, enabling rapid processing and feedback for dynamic data, ensuring data remains up-to-date.
2.2 Features and Advantages of Micro-Formulas
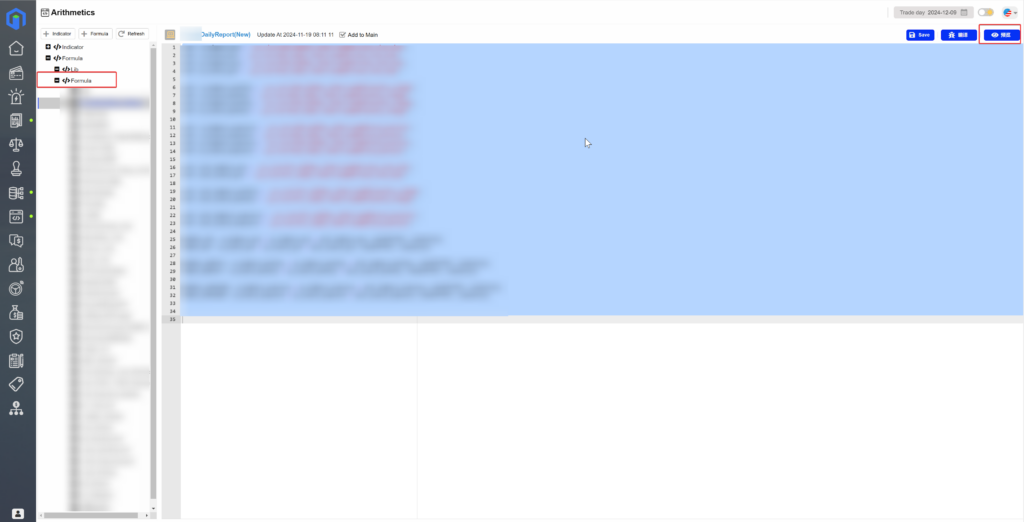
Micro-formulas are core functions in Feynman Language for data processing and metric calculations. They enable users to create temporary metrics and perform light data processing on raw datasets. Key benefits include:
- Flexible Customization: Users can define micro-formulas based on business needs to perform specific data processing tasks, providing rapid responses to various business scenarios.
- Efficient Computation: Micro-formulas focus only on essential data and metrics during computation, avoiding redundant calculations and significantly improving efficiency, especially for large-scale time-series data.
- Data Integration: Micro-formulas can incorporate information from multiple data sources for complex metric computations and comprehensive analysis, offering a multi-dimensional view of business dynamics.
2.3 Features and Advantages of X-Insight Dashboard
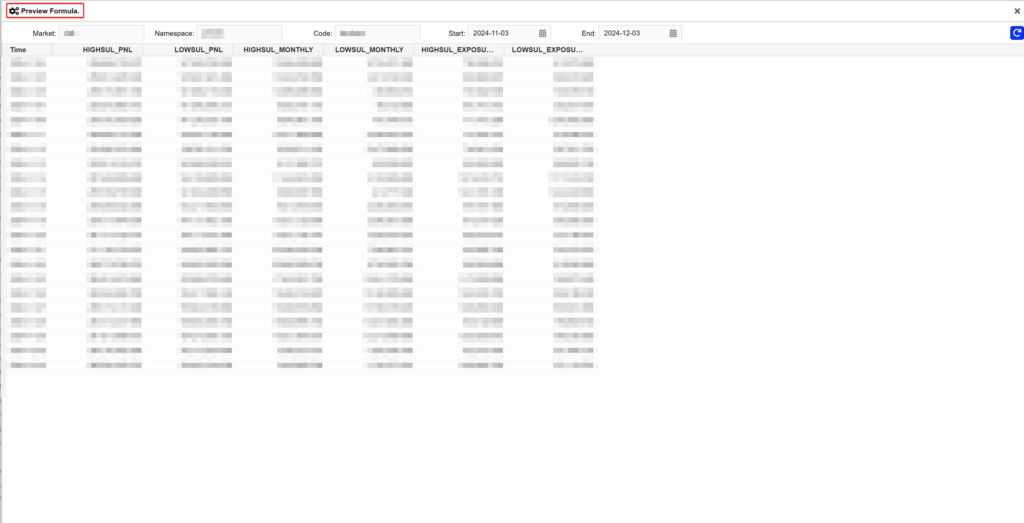
The X-Insight dashboard is X-Ray’s visualization tool, enabling users to display processed data intuitively in various chart formats. Key features include:
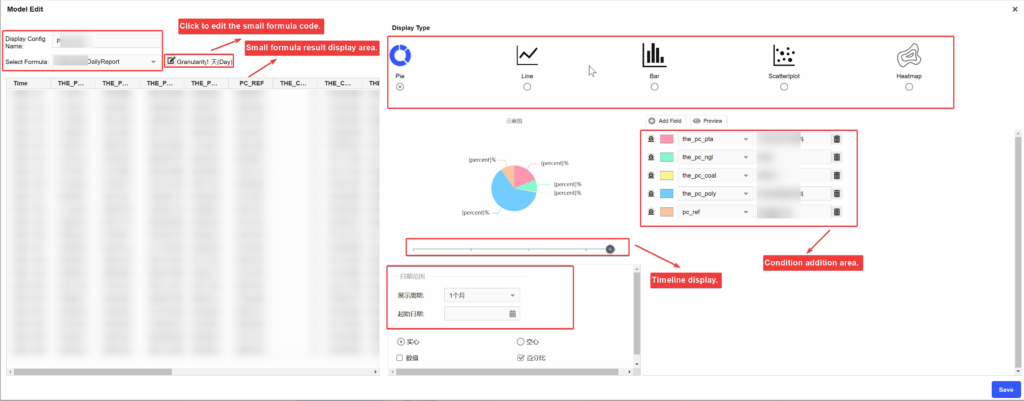
- Diverse Chart Types: X-Insight supports common chart types such as line charts, pie charts, area charts, scatter plots, radar charts, etc., allowing users to choose suitable formats for data presentation.
- Timeline Functionality: The dashboard includes timeline browsing, enabling users to visualize data trends over specific periods and gain insights into historical patterns and future projections.
- Customizable and Configurable: X-Insight offers a user-friendly interface for configuring charts (e.g., selecting micro-formulas, time ranges, display modes, and conditions). Users can personalize visualizations quickly, meeting unique needs.
2.4 Integrated Use of Feynman Language, Micro-Formulas, and X-Insight
The combination of Feynman Language, micro-formulas, and X-Insight forms a closed-loop system that covers data acquisition, processing, and dynamic visualization:
- Data Acquisition: Micro-formulas retrieve data from the X-Ray system for processing, allowing users to define computation formulas and automatically pull real-time data.
- Data Processing: Micro-formulas transform raw data into tailored results through flexible calculations, filters, and transformations.
- Dynamic Display: X-Insight visualizes processed data in intuitive charts, supports real-time updates, and enables users to monitor data changes continuously.
This closed-loop system enables X-Ray to provide efficient, flexible, and user-friendly tools for analyzing and visualizing data, helping enterprises extract insights from complex datasets and respond promptly to business changes.
III. How X-Ray Surpasses Traditional Tools in Addressing Pain Points
X-Ray’s data visualization solution excels in the following areas, helping enterprises overcome common challenges faced with traditional tools like Excel and BI systems:
3.1 Efficiency in Handling Complex Data
Unlike traditional tools requiring manual selection, data formatting, and formula creation, X-Ray enables efficient data processing and complex calculations through micro-formulas in Feynman Language. Users can define reusable micro-formulas with minimal effort, eliminating tedious, repetitive pre-visualization tasks.
3.2 Real-Time and Dynamic Display
X-Insight ensures data indicators are updated automatically in real-time. Its templates and timeline features support dynamic visualization of time-series data, enabling immediate feedback for business changes. Traditional tools, reliant on manual updates or batch imports, fail to achieve true real-time monitoring.
3.3 Flexibility and Customization
X-Ray offers unparalleled flexibility in defining data models and visualizations, meeting diverse enterprise needs. Traditional tools are often constrained by predefined templates, fixed chart types, or generic data models, limiting adaptability.
IV. Use Case: Real-Time Risk Monitoring in Commodity Trading
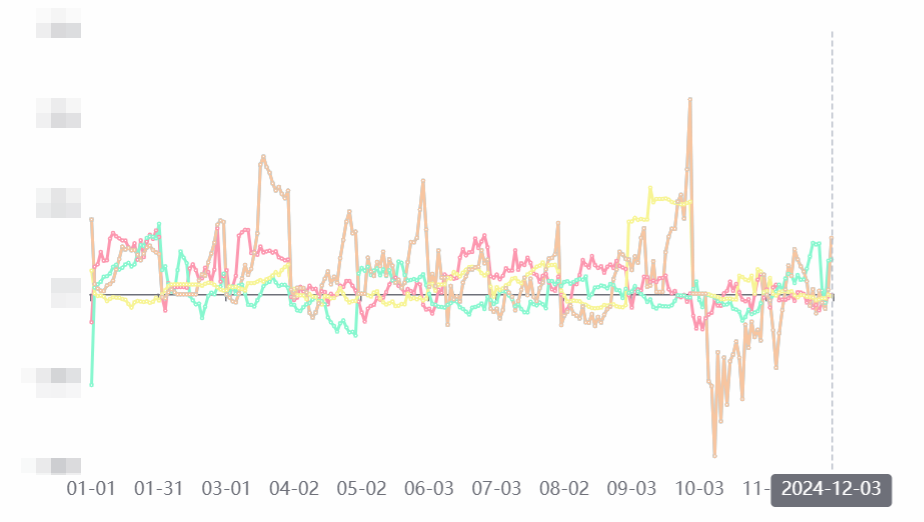
In commodity trading, monitoring market volatility and transaction risks in real-time is critical. X-Ray enables enterprises to define and calculate key metrics such as market volatility, inventory levels, and trading risks through micro-formulas in Feynman Language. These metrics are updated in real-time and visualized dynamically using X-Insight, providing instant insights to support precise decision-making.
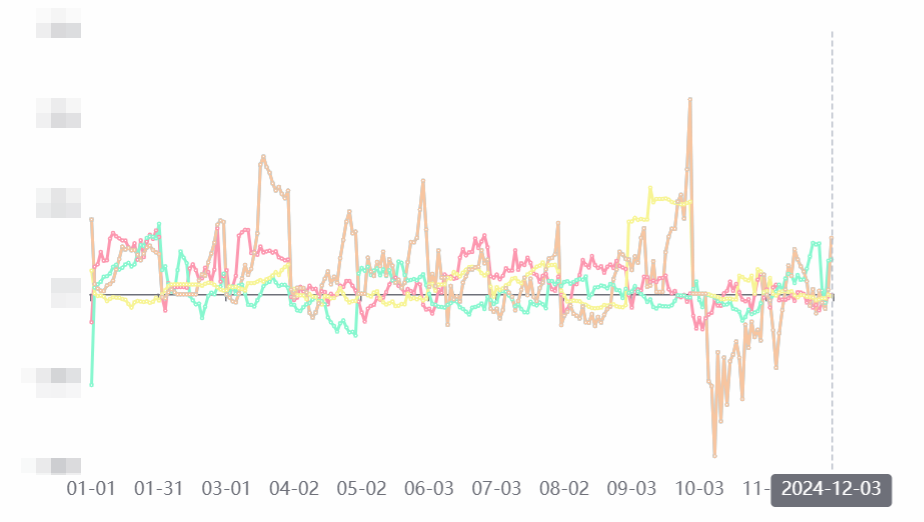
For example, in a major oil trading company (Z Company), X-Insight dashboards visualize trading and profit/loss data. These visualizations enable Z Company to monitor position profitability and effectively control market risks through detailed graphical representations.
Conclusion
As enterprise data analysis needs evolve, traditional tools like Excel and BI systems can no longer meet the demands for efficient, real-time, and flexible data visualization. X-Ray’s innovative combination of Feynman Language, micro-formulas, and X-Insight dashboards effectively addresses these challenges. With this complete solution, enterprises can define data metrics rapidly, process and display data in real-time, and achieve more efficient analysis and decision support.
Looking ahead, as data scales continue to expand, X-Ray will further assist enterprises in tackling more complex business challenges, advancing data-driven decision-making.

